
Representing statistical data can be hard, especially when displaying the information on a website. On one side, you want to represent the data as accurate as possible. On the other hand, you don’t want it to affect the look of the website adversely. Fortunately, there are ways that you can adopt that will ensure that you achieve the two aspects simultaneously.

An excellent example is the graphs. As far as demonstrating data analysis is concerned, one must admit that they are perfect since they make it easy for your viewers to understand. They are also easy to create, even when dealing with a huge amount of data. To make it even easier, you can always go for a jQuery organizational chart library. Below is a discussion of the Top 7 jQuery Organizational Chart Libraries.
1. FancyGrid – jQuery Organizational Chart Libraries
If you are an enterprise looking for an excellent way of displaying your figures, this jQuery organizational chart library is suitable. It combines both form and grid solutions. There is much to achieve using the library, from server communication to chart integrations.
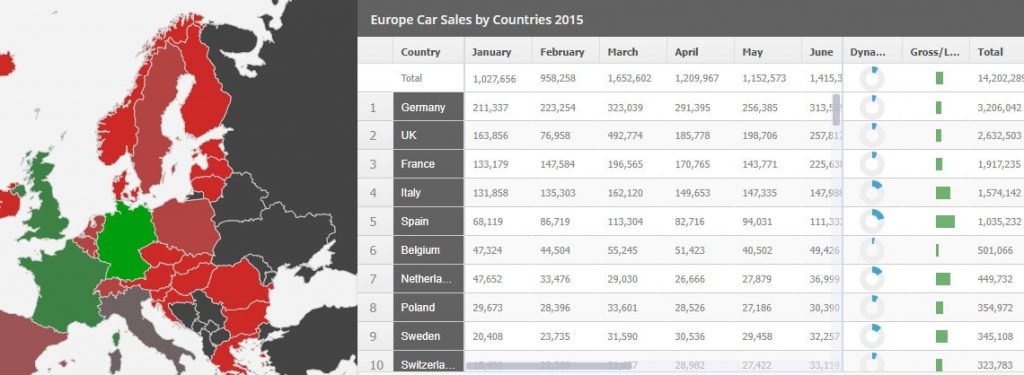
You are at liberty to add different themes depending on your needs and preferences. Additionally, you can manipulate data by validating, filtering, sorting and paging it. Feel free to add a file or AJAX data whenever a need arises. Other available features are form modulation and touch screen compatibility.
2. Calx
This jQuery organizational chart library will save the day, whether you want a doughnut, bar or line graph. Besides that, one can create different calculation forms based on various formulas for the ideal output at the end of the day. The plugin combines a formula parser and an Excel calculation engine to facilitate the operation. It also means that you can easily use excel functions when using the library.
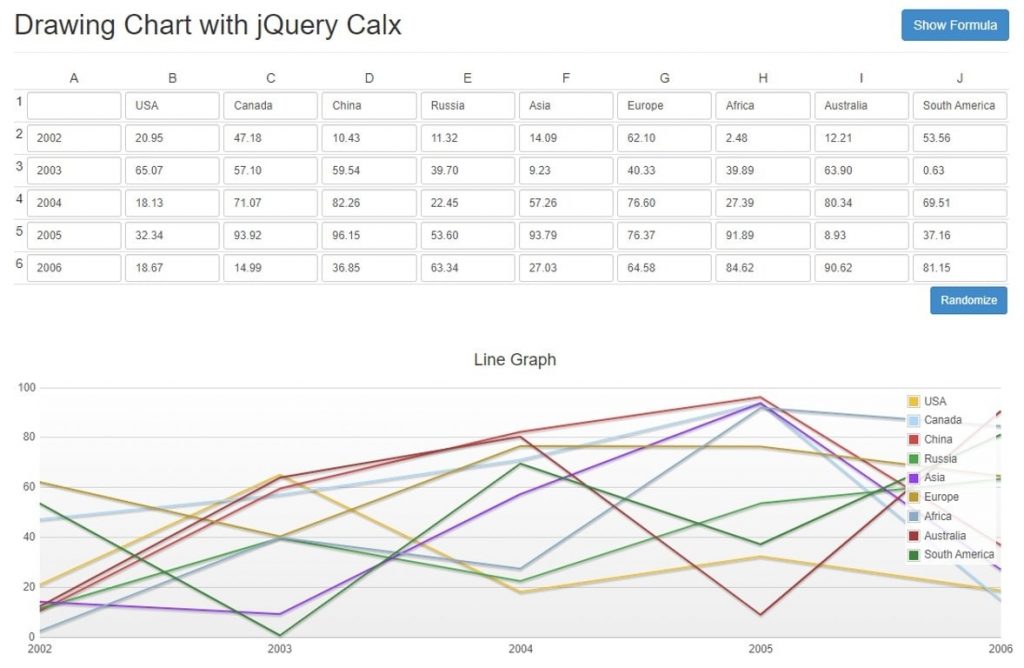
It is customizable to meet the needs of various users and companies. You are also at liberty to rewrite or override an existing function if need be. You don’t have to worry about integrating the form and the charts since it is always seamless.
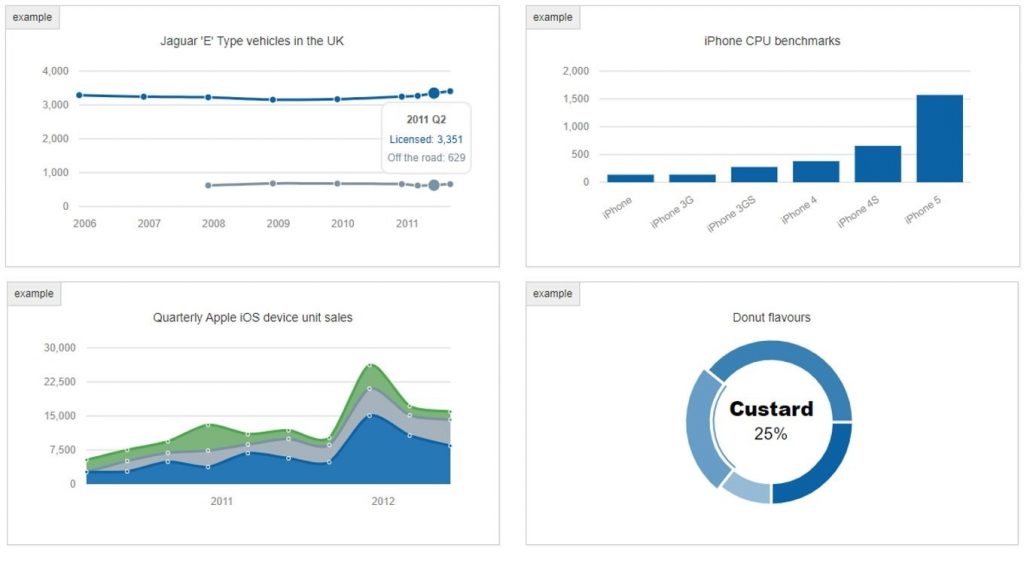
3. jqPlot
It is a go-to jQuery organizational chart library if you want to generate client-side charts using JS. It gives you various options to choose from, including pyramid, pie, step, waterfall, bubble, area and bar charts. So, feel free to choose the one you deem fit whenever you choose to work with it.
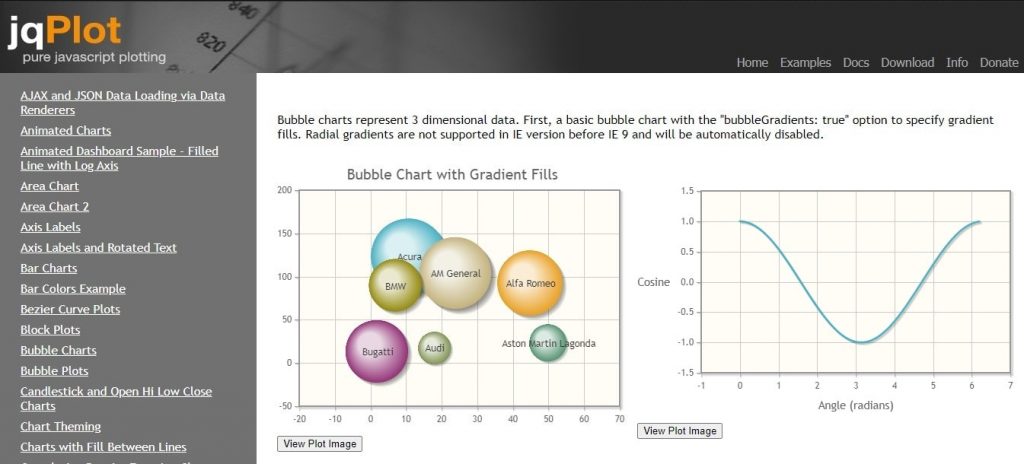
Expect ease of use despite the diversity and various options. It is also possible to render the charts using AJAX JSON data. The data will be displayed upon hovering the mouse. It is worth mentioning that the charts are animated. You should also expect Mekko Charts and Lorenz Curves.
4. CanvasJS
By writing a few lines of code, this jQuery organizational chart library will ensure that you develop graph charts that are responsive and interactive. Its integration with other common JS frameworks such as bootstrap is also seamless. You can choose among various types of charts, including financial charts, bar charts and line charts. As a matter of fact, you have up to 30 types to choose from.
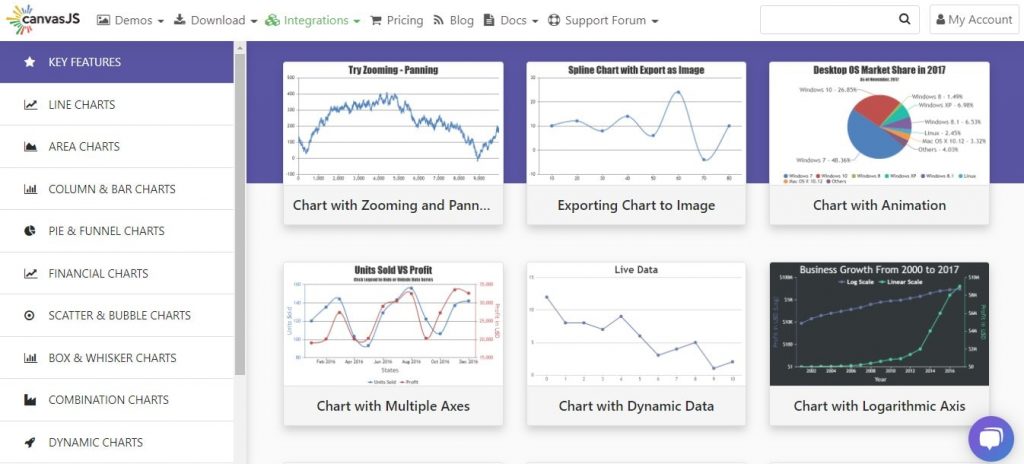
It is important to note that they are easy to customize to fit the various needs of different people and organizations. Manipulating the charts is also easy given the various features such as exporting images, zooming and panning. Last but not least, the updates are dynamic; hence no need to worry about ensuring that the data is up to date.
5. Cytoscape.js
If you aim to go for something different from the normal graphs, this jQuery chart library is worth a shot. Its popularity results from its uniqueness and relevance are given the many similarities of the various options out there. The sector needed a breath of fresh air, and that’s what the Cytoscape.js offered.
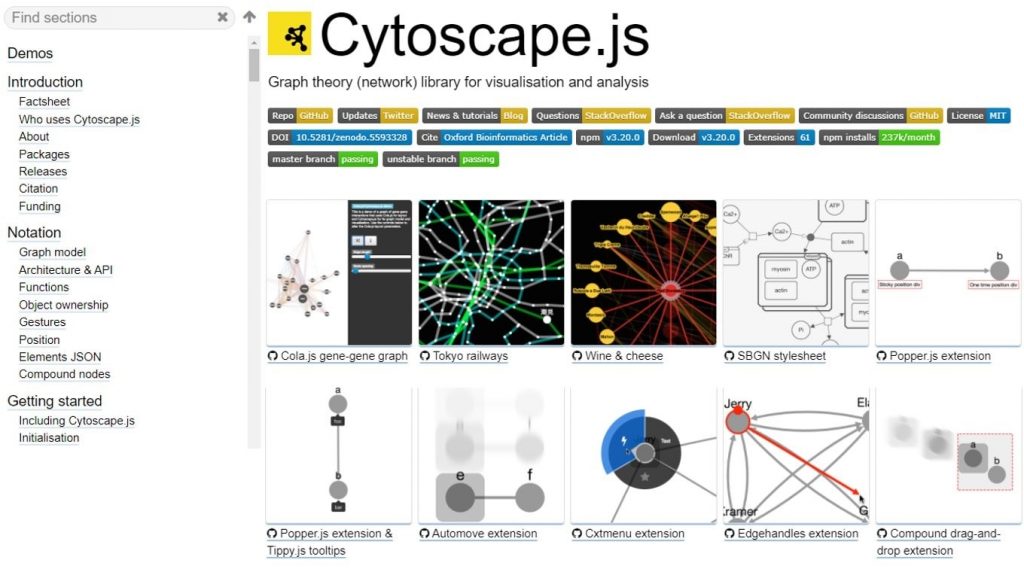
Its optimization is commendable, especially when creating interactive graphs. The library is also compatible with various browsers, including the modern ones hence no need to worry about what your visitors will use to browse your site. It also works smoothly with the graph and set theories’ operations.
It is important to mention the availability of useful features such as panning, pinch to zoom, and box selection, just but to mention a few. The library is also easy to customize, animate and extend whenever necessary. Last but not least is the great documentation that makes it easy to use.
6. Morris.js
If you have different data sets that need to be displayed well without confusing your viewers, this jQuery organizational chart library will play the trick. It has many advantages, including ease of implementation and a great visual appearance.
Due to its simple API, the library is quite common among people intending to draw area, doughnut, line and bar charts just but to mention a few. It is also important to note that it has other features at your disposal, including touch event handling.
7. OrgChart
Last but not least, as far as our list of the top 7 jQuery organizational chart libraries is concerned, is the OrgChart. You can rest assured that they won’t disappoint when creating a structural tree. It makes the process as simple as providing the HTML element id and then calls to the extension. You only need a single line to do so; hence, there is no need to worry about it.
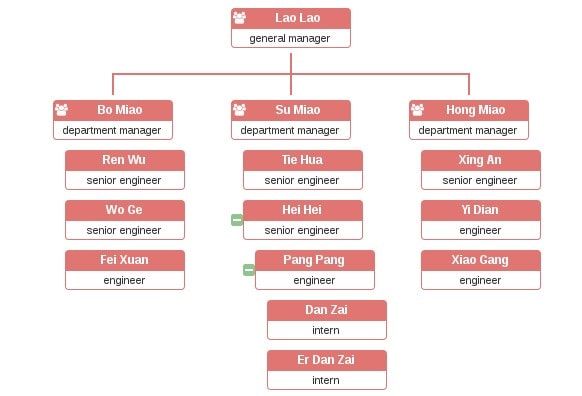
It is the most suitable option when dealing with nested yet unordered lists. It allows you to use either local data or JSON data depending on what you have at that particular time. Thanks to the CSS3 transitions, the expanding and collapsing effects becomes pretty smooth. It is also easy to drag and drop the nodes to fit what you are looking for in the end.
It is also possible to edit your chart dynamically. Additionally, you are at liberty to store your final hierarchies as JSON objects. Alternatively, export the chart as a pdf document or a picture. Last but not least, it is touch-enabled and supports zooming and panning.