What better way to represent data than by using charts and graphs? Ever wondered which CSS chart or graph to use? This article is for you. As the case may be, CSS makes it possible to represent complex data in a way that is convenient for visitors to understand the content of the website or webpage.
A high level of competence should be reflected in the simplicity and flexibility of the represented data. This is where CSS graphs and charts come in. This markup language is a lifeguard for the pools of representing content and data.
This article will show 27 types of CSS and graphs to use and attract more visitors. But first.
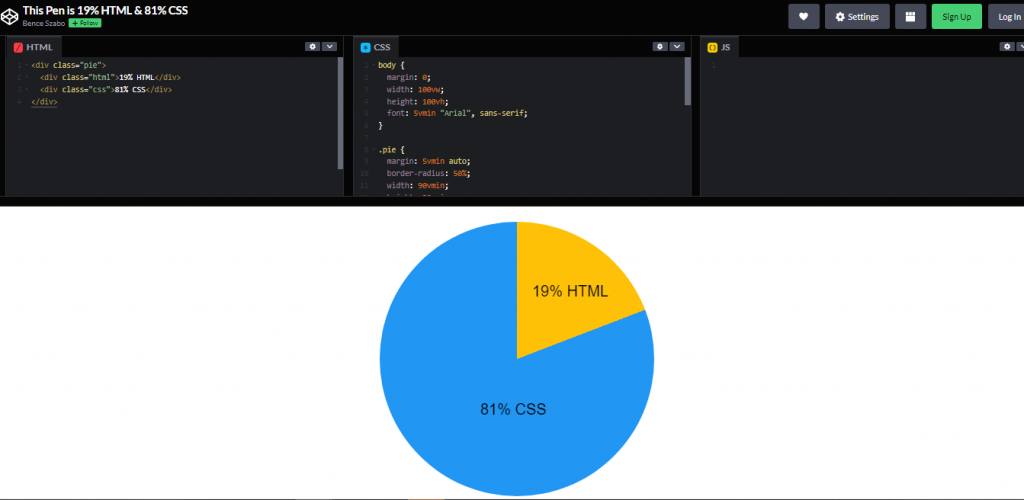
1. CSS-ONLY PIE CHARTS
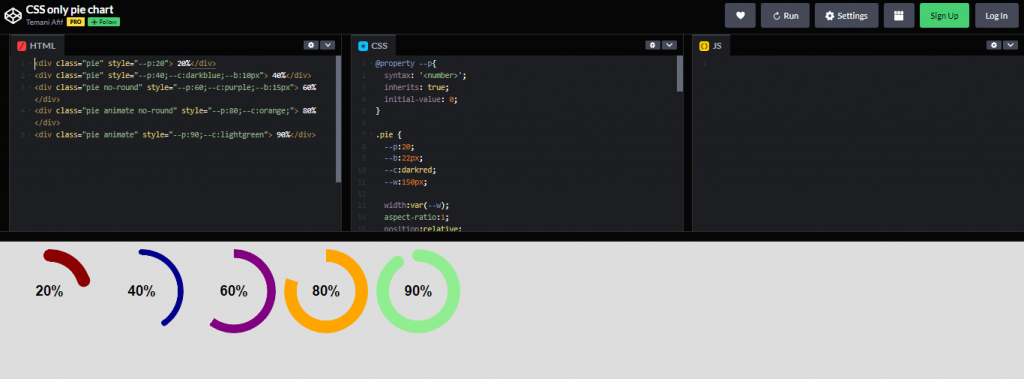
Compatible browsers: Chrome, Edge, Firefox, Opera, Safari
Responsive: No
2. SKILLS CHART ANIMATION WITH A BIT OF HOUDINI MAGIC

Compatible browsers: Chrome, Edge, Firefox, Opera, Safari
Responsive: No
3. PURE CSS AREA CHART
Compatible browsers: Chrome, Edge, Firefox, Opera, Safari
Responsive: No
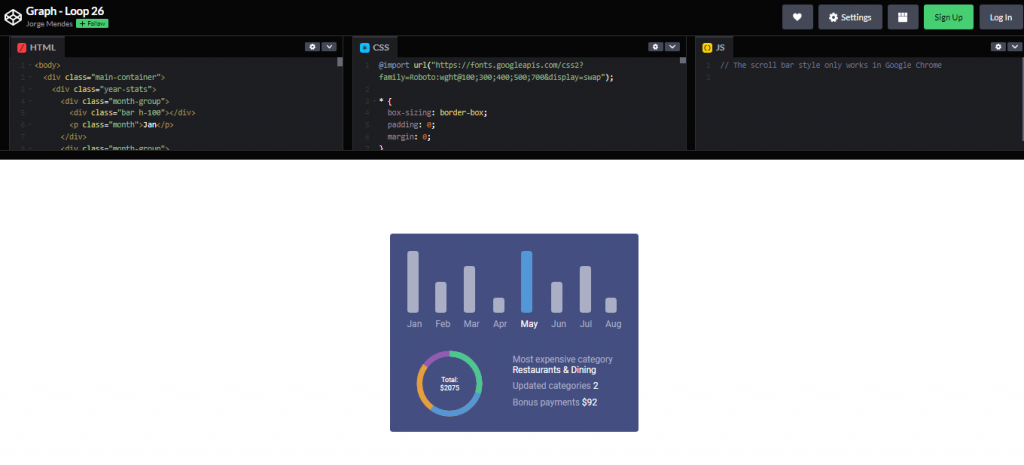
4. GRAPH
Compatible browsers: Chrome, Edge, Firefox, Opera, Safari
Responsive: No
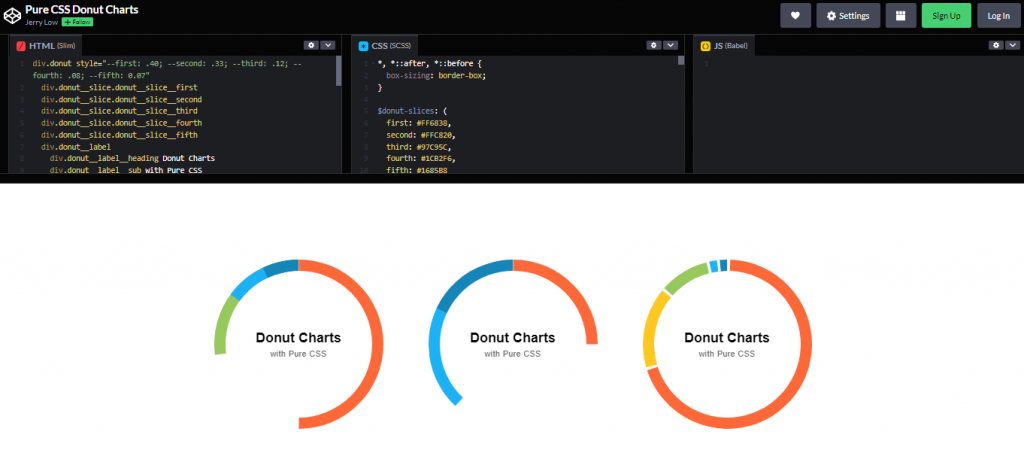
5. PURE CSS DONUT CHARTS
Compatible browsers: Chrome, Edge, Firefox, Opera, Safari
Responsive: No
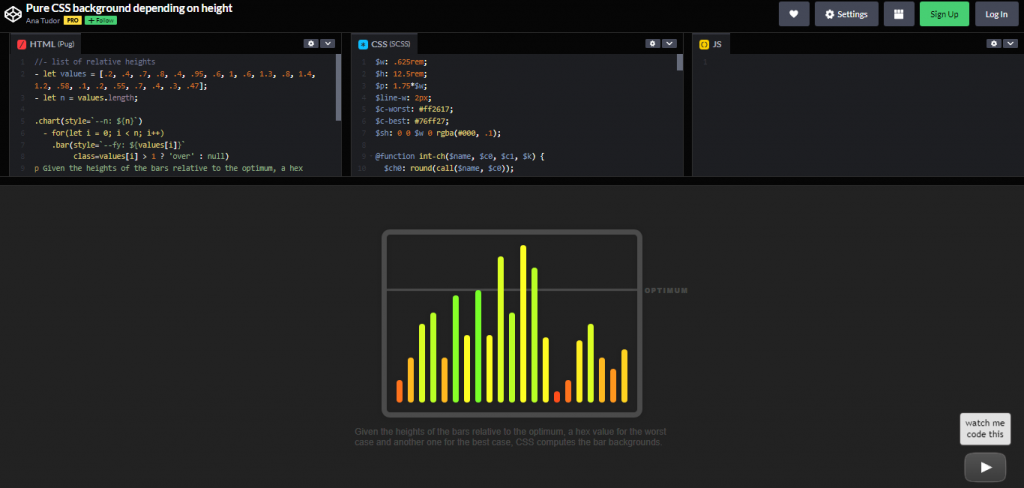
6. PURE CSS BACKGROUND DEPENDING ON HEIGHT
Compatible browsers: Chrome, Edge, Firefox, Opera, Safari
Responsive: No
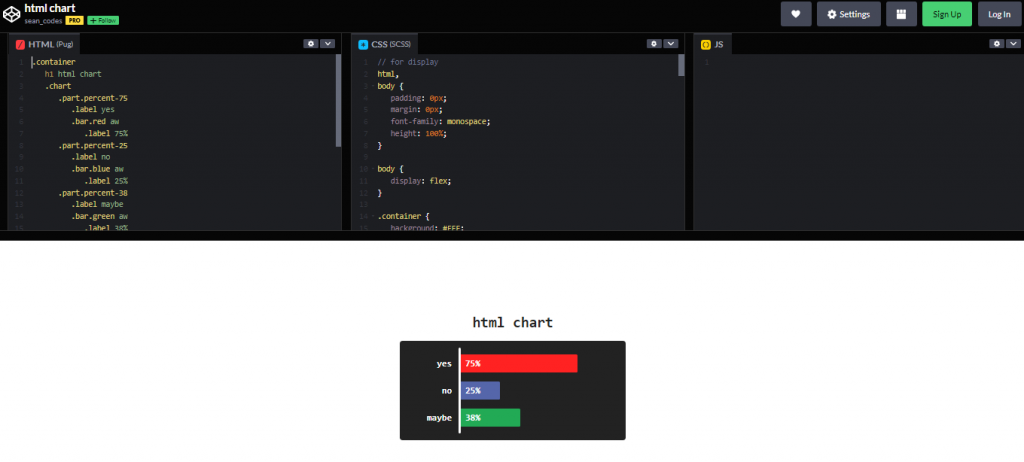
7. HTML CHART
Compatible browsers: Chrome, Edge, Firefox, Opera, Safari
Responsive: No
8. PURPLE PIE CHART
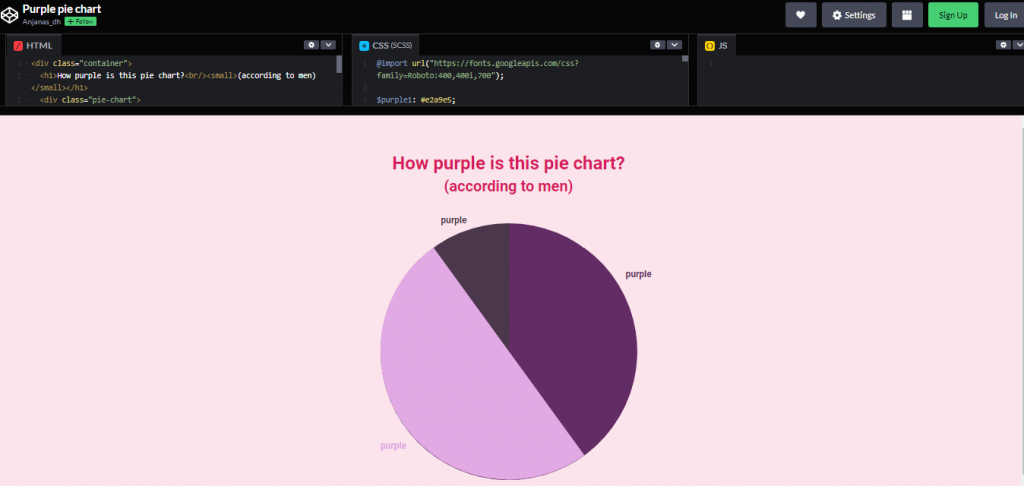
Compatible browsers: Chrome, Edge, Firefox, Opera, Safari
Responsive: No
9. STATISTICS CARD
Compatible browsers: Chrome, Edge, Firefox, Opera, Safari
Responsive: No
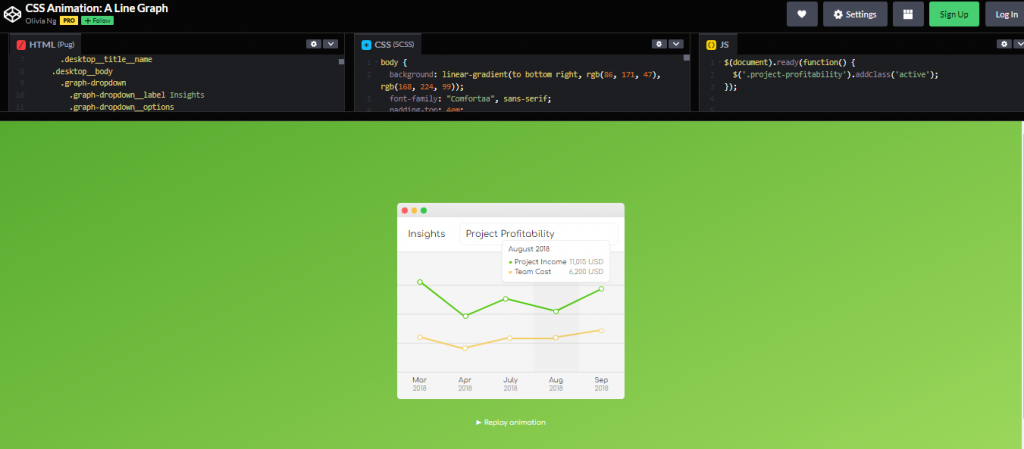
10. CSS ANIMATION: A LINE GRAPH
Compatible browsers: Chrome, Edge, Firefox, Opera, Safari
Responsive: No
Compatible browsers: Chrome, Edge, Firefox, Opera, Safari
Responsive: no
Dependencies: simple-line-icons.css, jquery.js
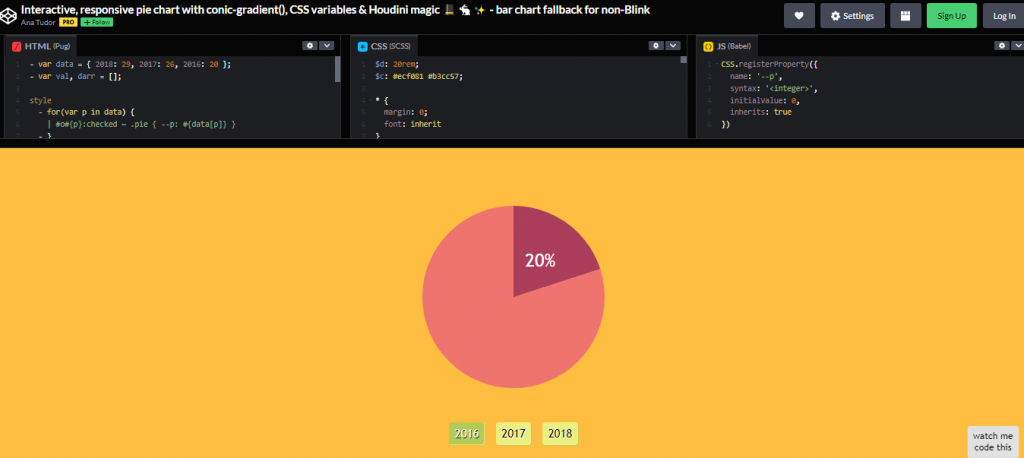
11. INTERACTIVE, RESPONSIVE PIE CHART
Interactive, responsive pie chart with conjjic-gradient(), CSS variables & Houdini magic.
Compatible browsers: Chrome, Edge, Firefox, Opera, Safari
Responsive: yes
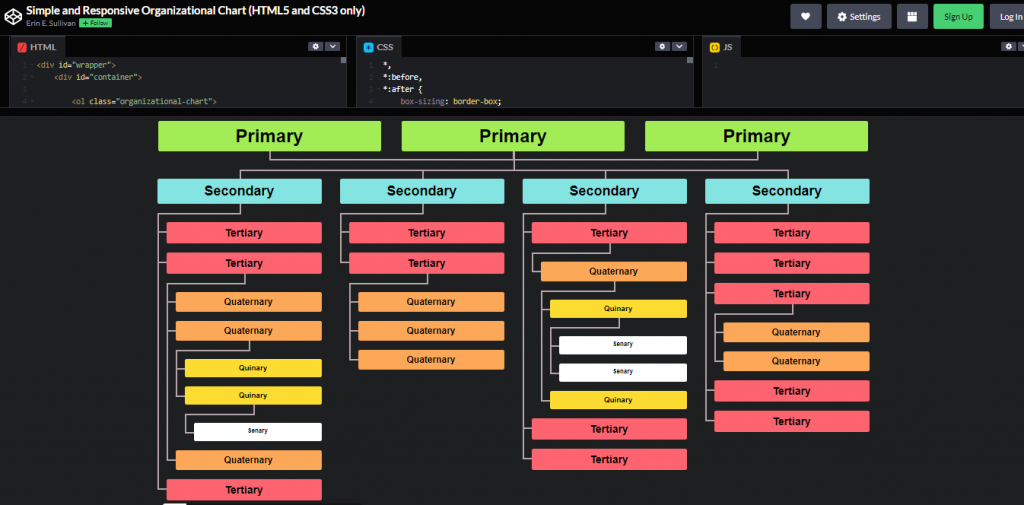
12. SIMPLE AND RESPONSIVE ORGANIZATIONAL CHART
HTML5 and CSS3 are only simple and responsive organizational charts.
Compatible browsers: Chrome, Edge, Firefox, Opera, Safari
Responsive: yes
13. CHARLES HAYTER’S COLOUR DIAGRAMS
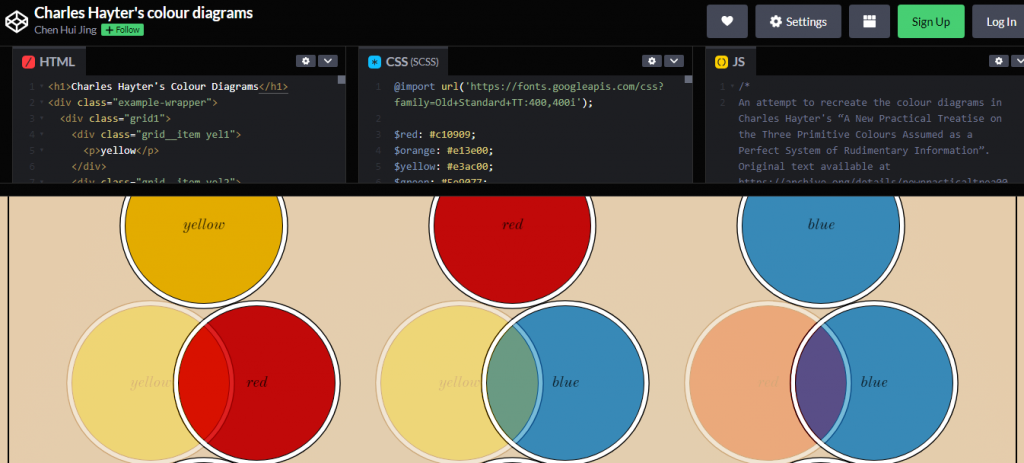
An attempt to recreate the color diagrams in Charles Hayter’s “A New Practical Treatise on the Three Primitive Colours Assumed as a Perfect System of Rudimentary Information.”
Compatible browsers: Chrome, Edge, Firefox, Opera, Safari
Responsive: yes
14. INTERACTIVE SVG & CSS GRAPH
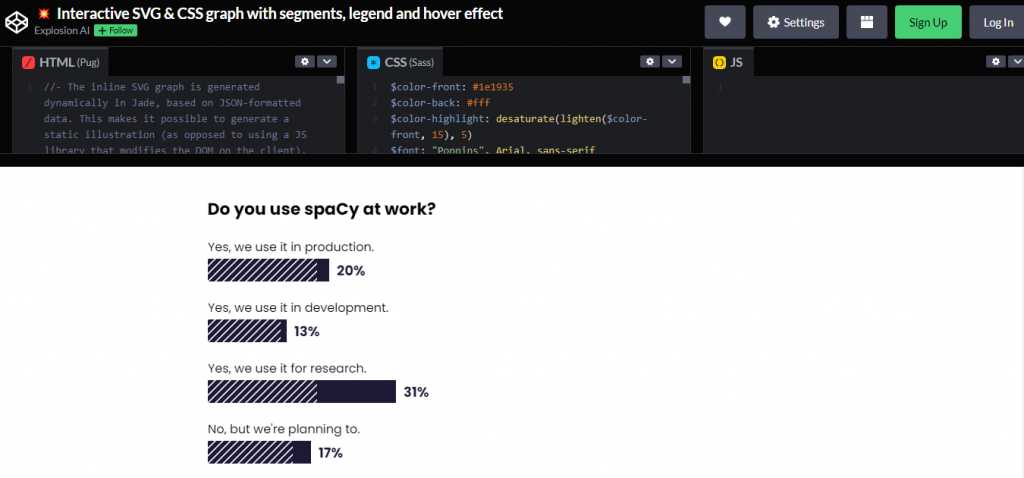
Interactive SVG & CSS graph with segments, legend, and hover effect.
Compatible browsers: Chrome, Edge, Firefox, Opera, Safari
Responsive:no
15. ANIMATED CSS GRAPH
Compatible browsers: Chrome, Edge, Firefox, Opera, Safari
Responsive: yes
16. PURE CSS BARS
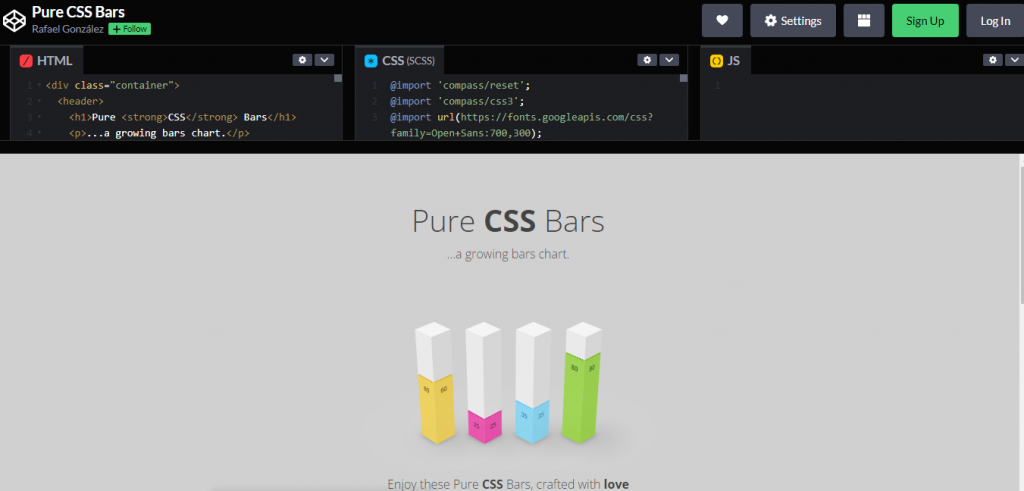
Compatible browsers: Chrome, Edge, Firefox, Opera, Safari
Responsive: yes
17. CSS ONLY 3D BAR GRAPH
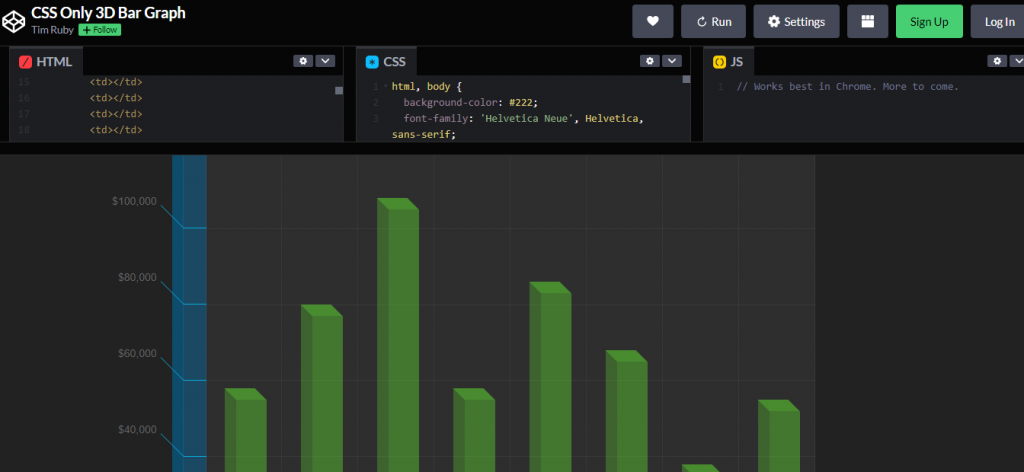
Compatible browsers: Chrome, Edge, Firefox, Opera, Safari
Responsive: no
18. CIRCLE CHART WITH THREE BARS
Compatible browsers: Chrome, Edge, Firefox, Opera, Safari
Responsive: no
Conclusion
Other fun and intriguing charts and graphs can be used in different aspects of one’s business. In our next article, we will cover seven more and discuss the benefits of some over others. Stay tuned.